GraphQL basic features
In the previous chapter we saw how to create a project with Hasura and Docker in a matter of minutes …
read moreSerie: Docker Hasura Graphql
We have seen the basic functionalities to manage our data that GraphQL offers us.
Operations like Query, Mutation and Subscription of GraphQL allow us to obtain, create, update and delete data with
a very simple and easy to learn syntax.
Now we are going to see the different options that Hasura provides us by default to manage the database, to execute server-side tasks or connect to external services.
For this example we are going to download a database already filled with sample data,
specifically the one containing information from a movie rental business called Pagila.
We simply need to import the schema and sample data with psql. Then we can create the connection to the virtualized database
from the Hasura panel as we saw in the first chapter of the series.
In the docker-compose file we have to add the ports clause to the postgres section in order to be able to connect from
our host machine:
version: '3.6'
services:
  postgres:
    image: postgres:12
    ports:
      - "5432:5432"
    volumes:
    ...
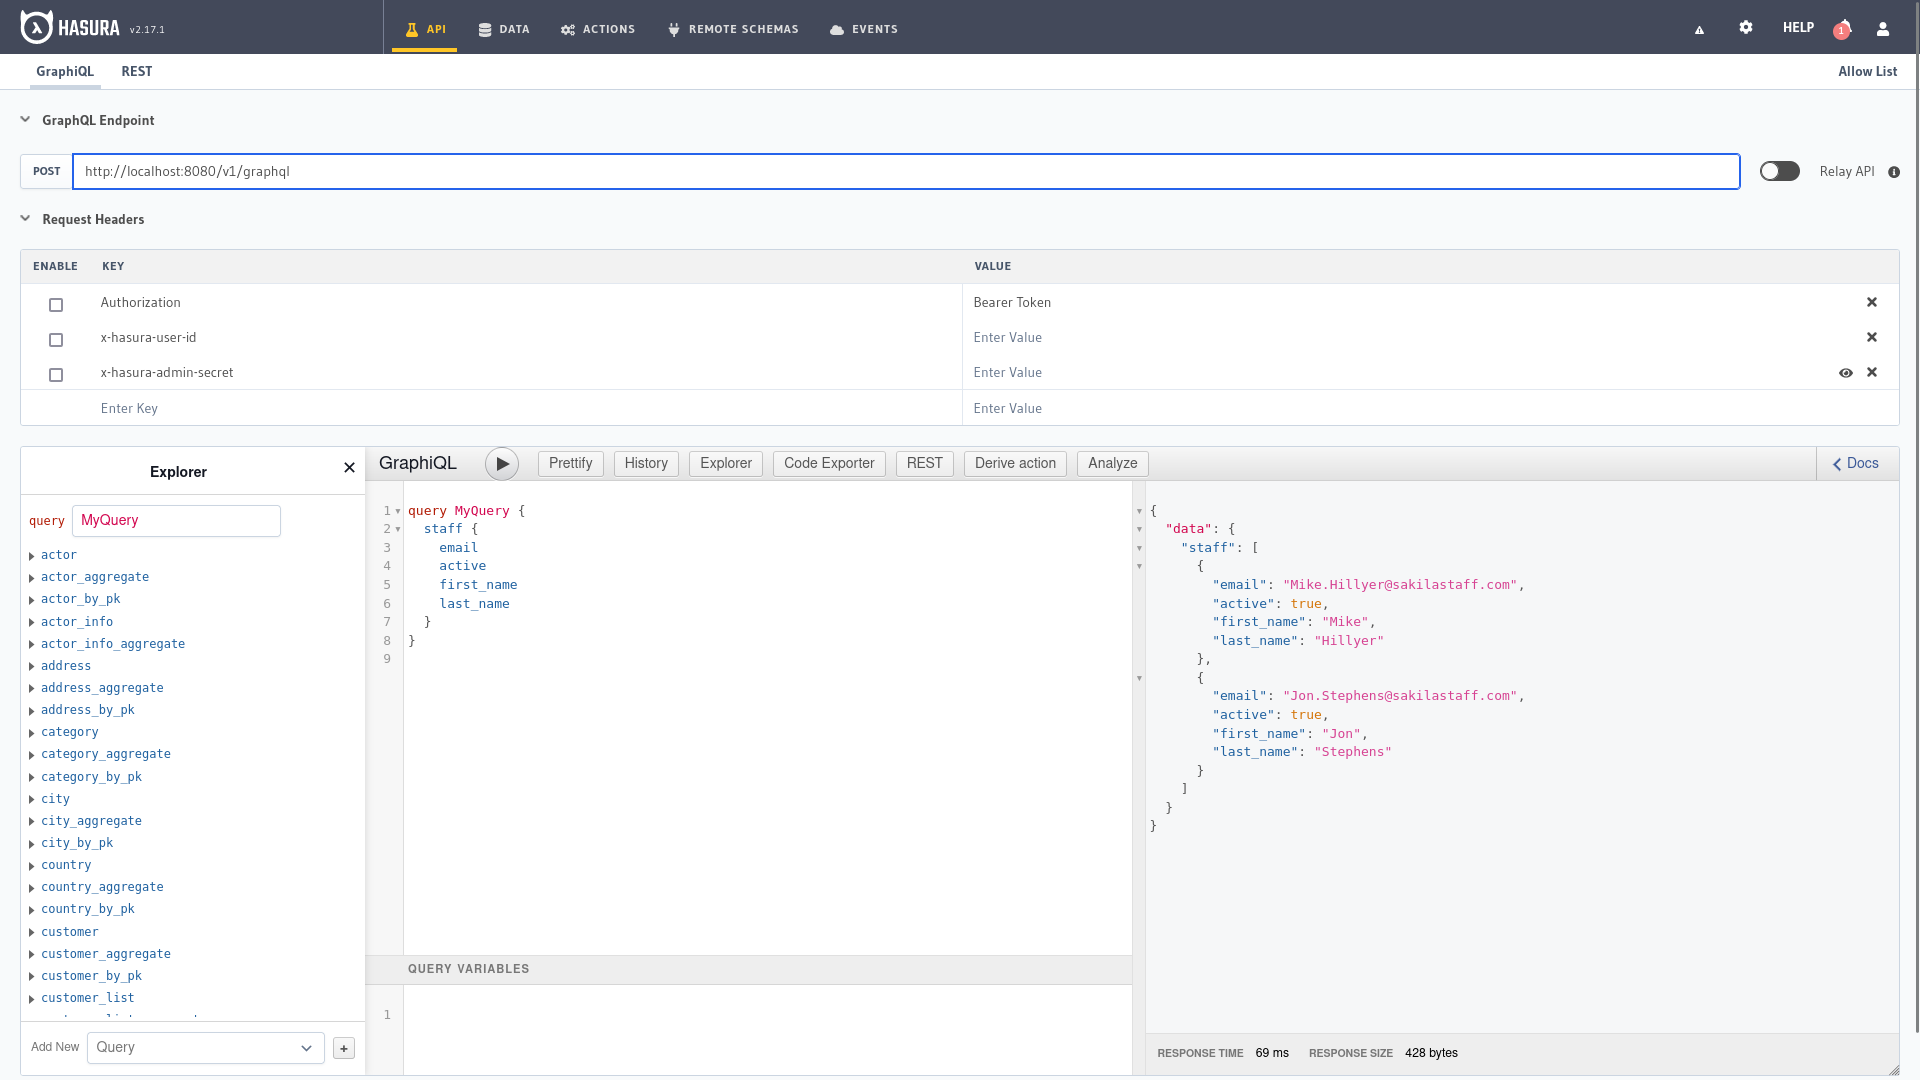
This is the first screen we find when we enter the Hasura administration panel where we have several well differentiated parts,
at the top is the URL of our endpoint and the parameters included in the API request header.
On the left side the explorer to navigate through the different entities, GraphiQL to make queries in the center and
the documentation where to query the different parameters and options available on the right. At the bottom we would write the
values of the variables in JSON format if requests make use of variables in GraphiQL.
In the previous chapter we already saw multiple examples that we can copy and adapt to run right here or we can use the explorer to build our query with the different filters, selection and sorting options from the explorer.
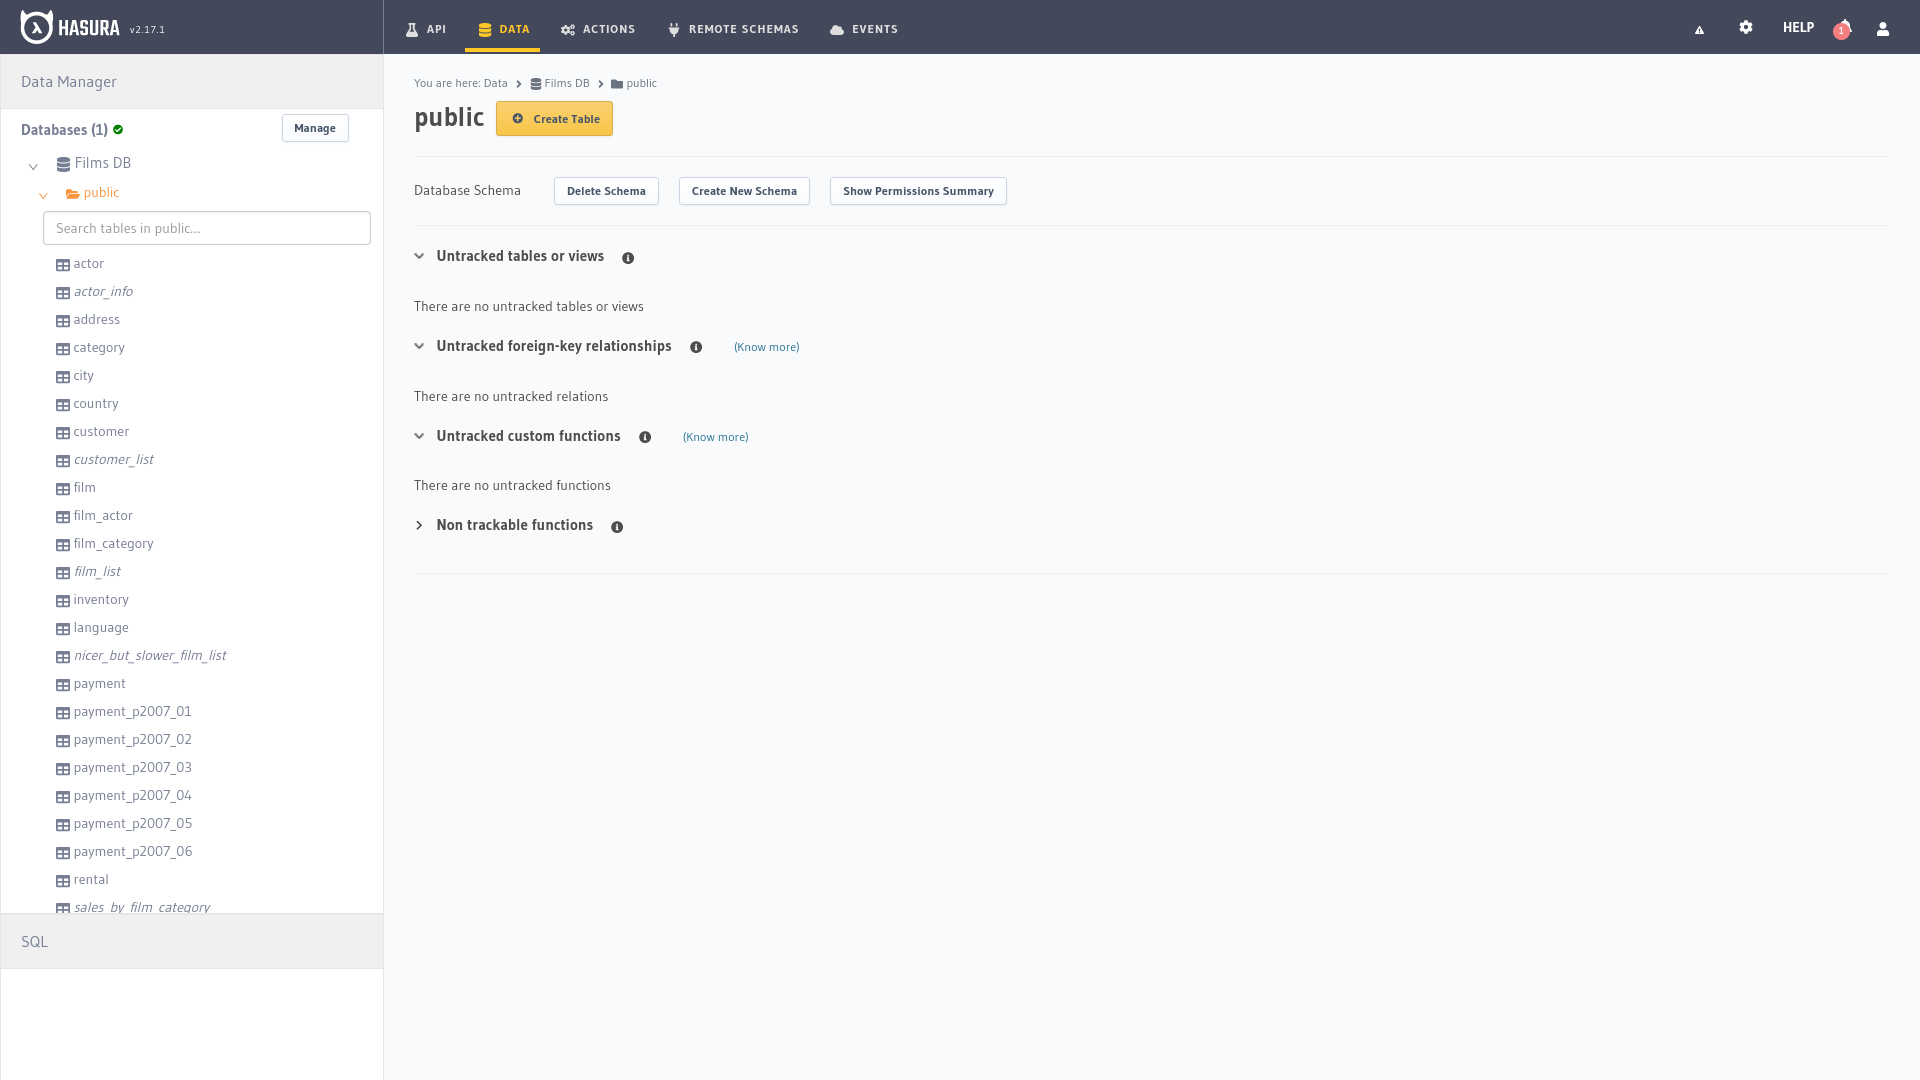
As soon as we open the second tab we find a data manager on the left and on the right the tables that are being tracked and those that aren’t. At the bottom left there is a button that will open a window to execute SQL queries manually.
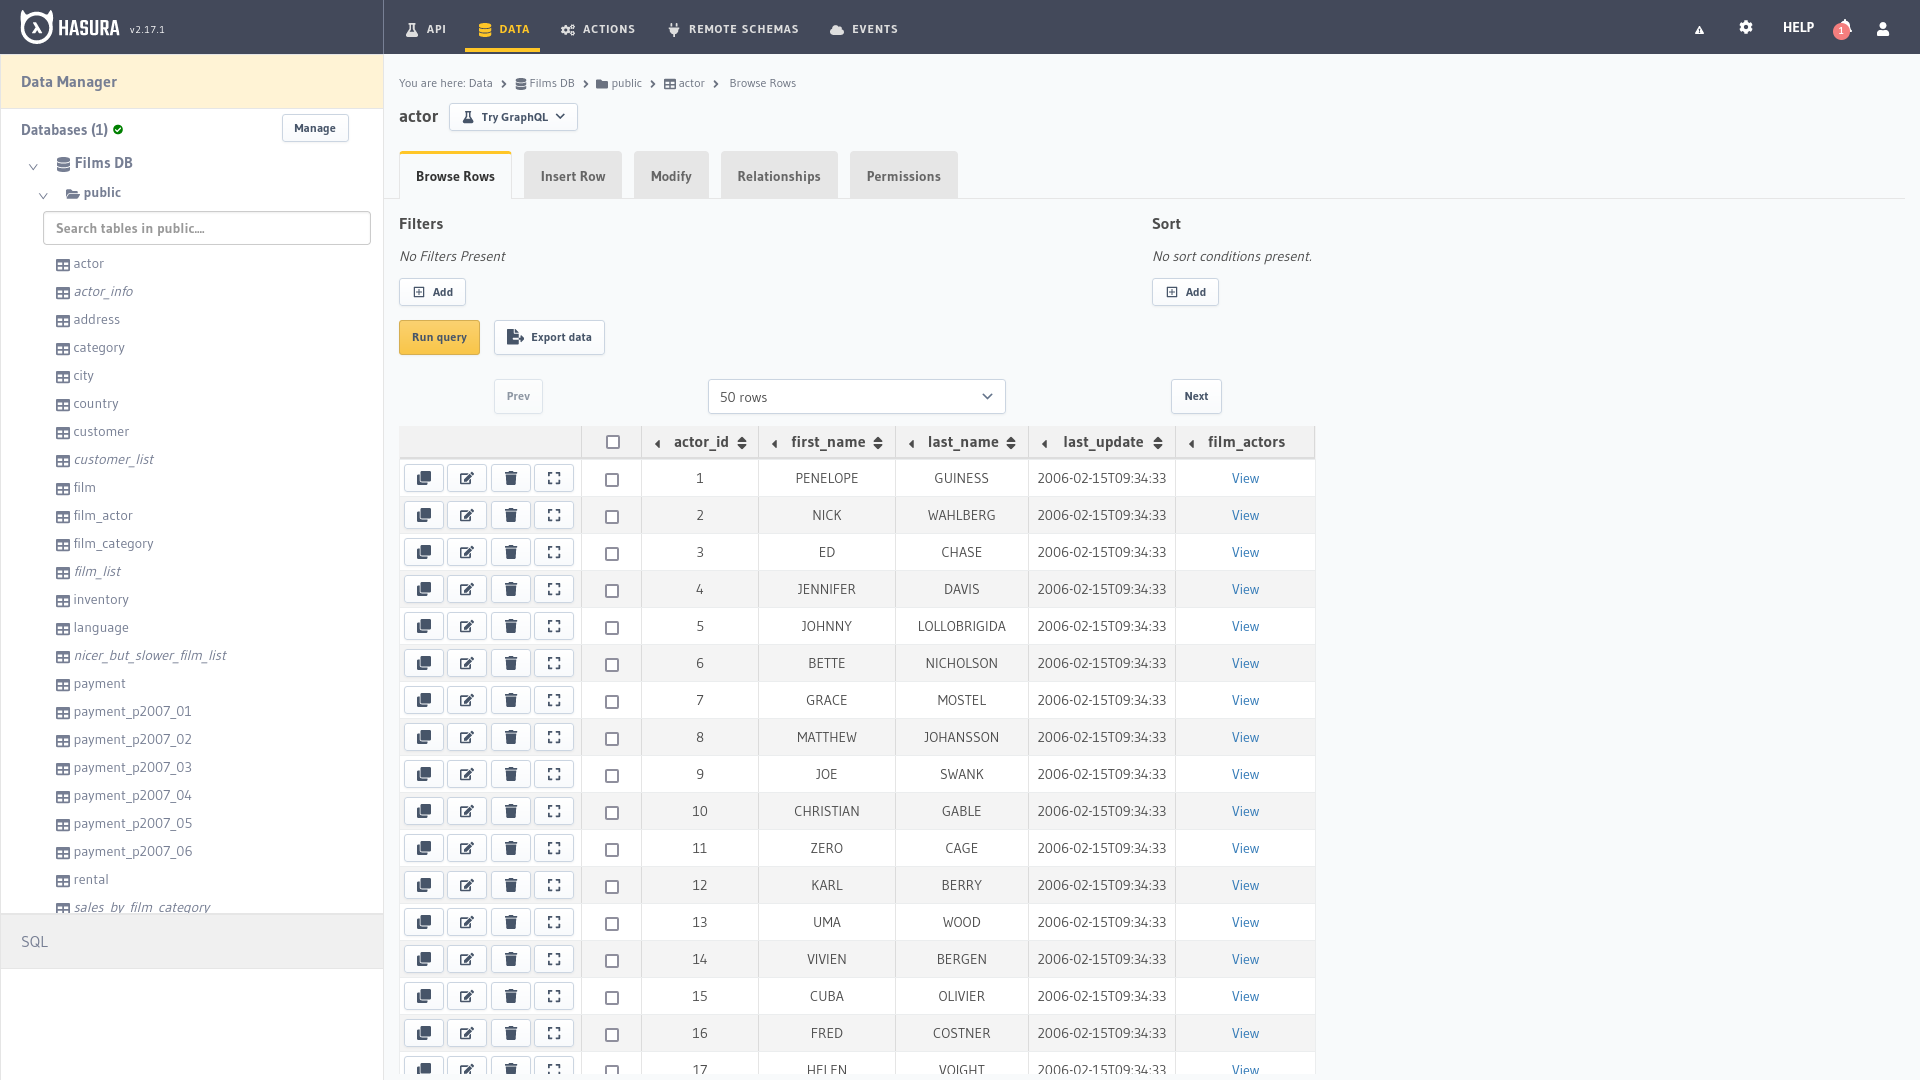
Selecting any of the entities in the left hand side the manager will show us the records from the table as well as allowing us to add new rows or modify existing ones, the relationships between the entities and the permissions to access the data through the API.
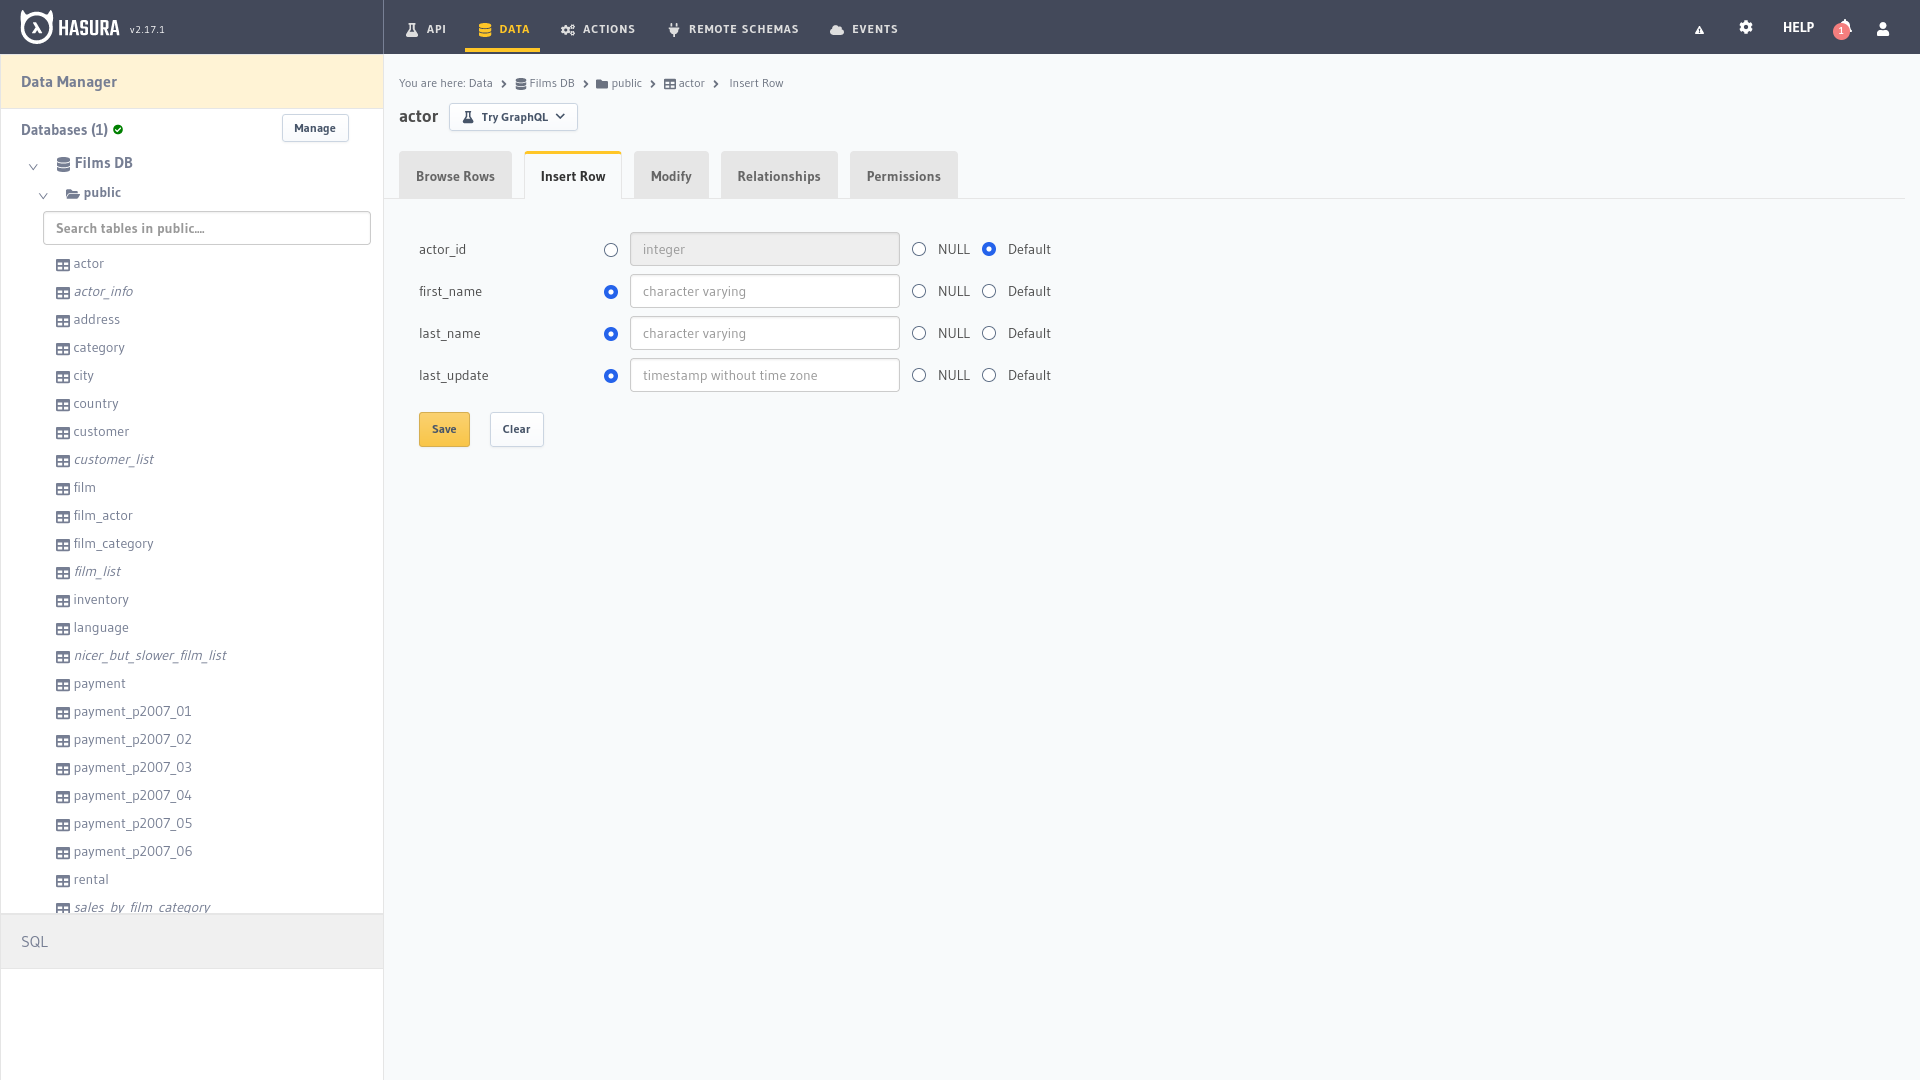
At this point we simply have to fill in the fields to insert a new record in the selected table.
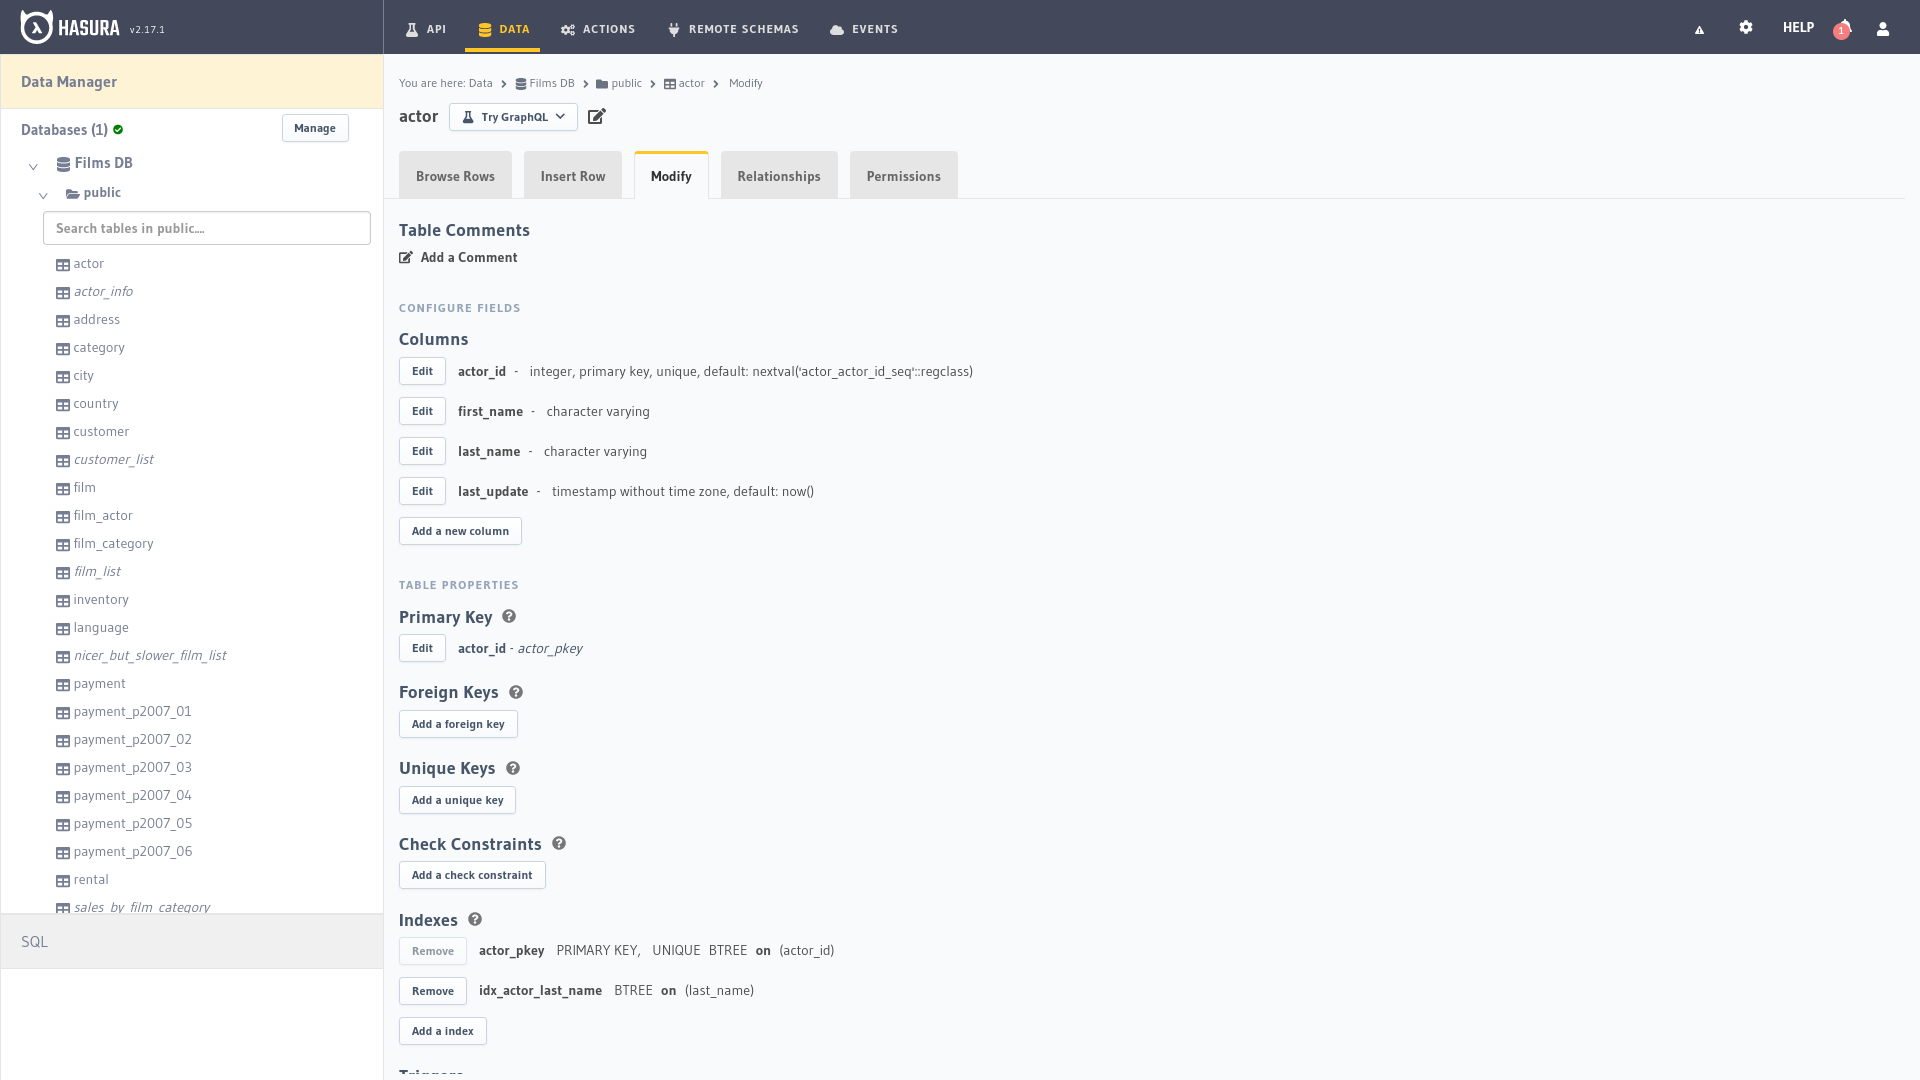
The Modify tab allows us to change the parameters of the different columns and to add new ones, triggers, constraints,
indexes and so on, it also allows us to set the table as an enum type for fixed data or to create a computed field.
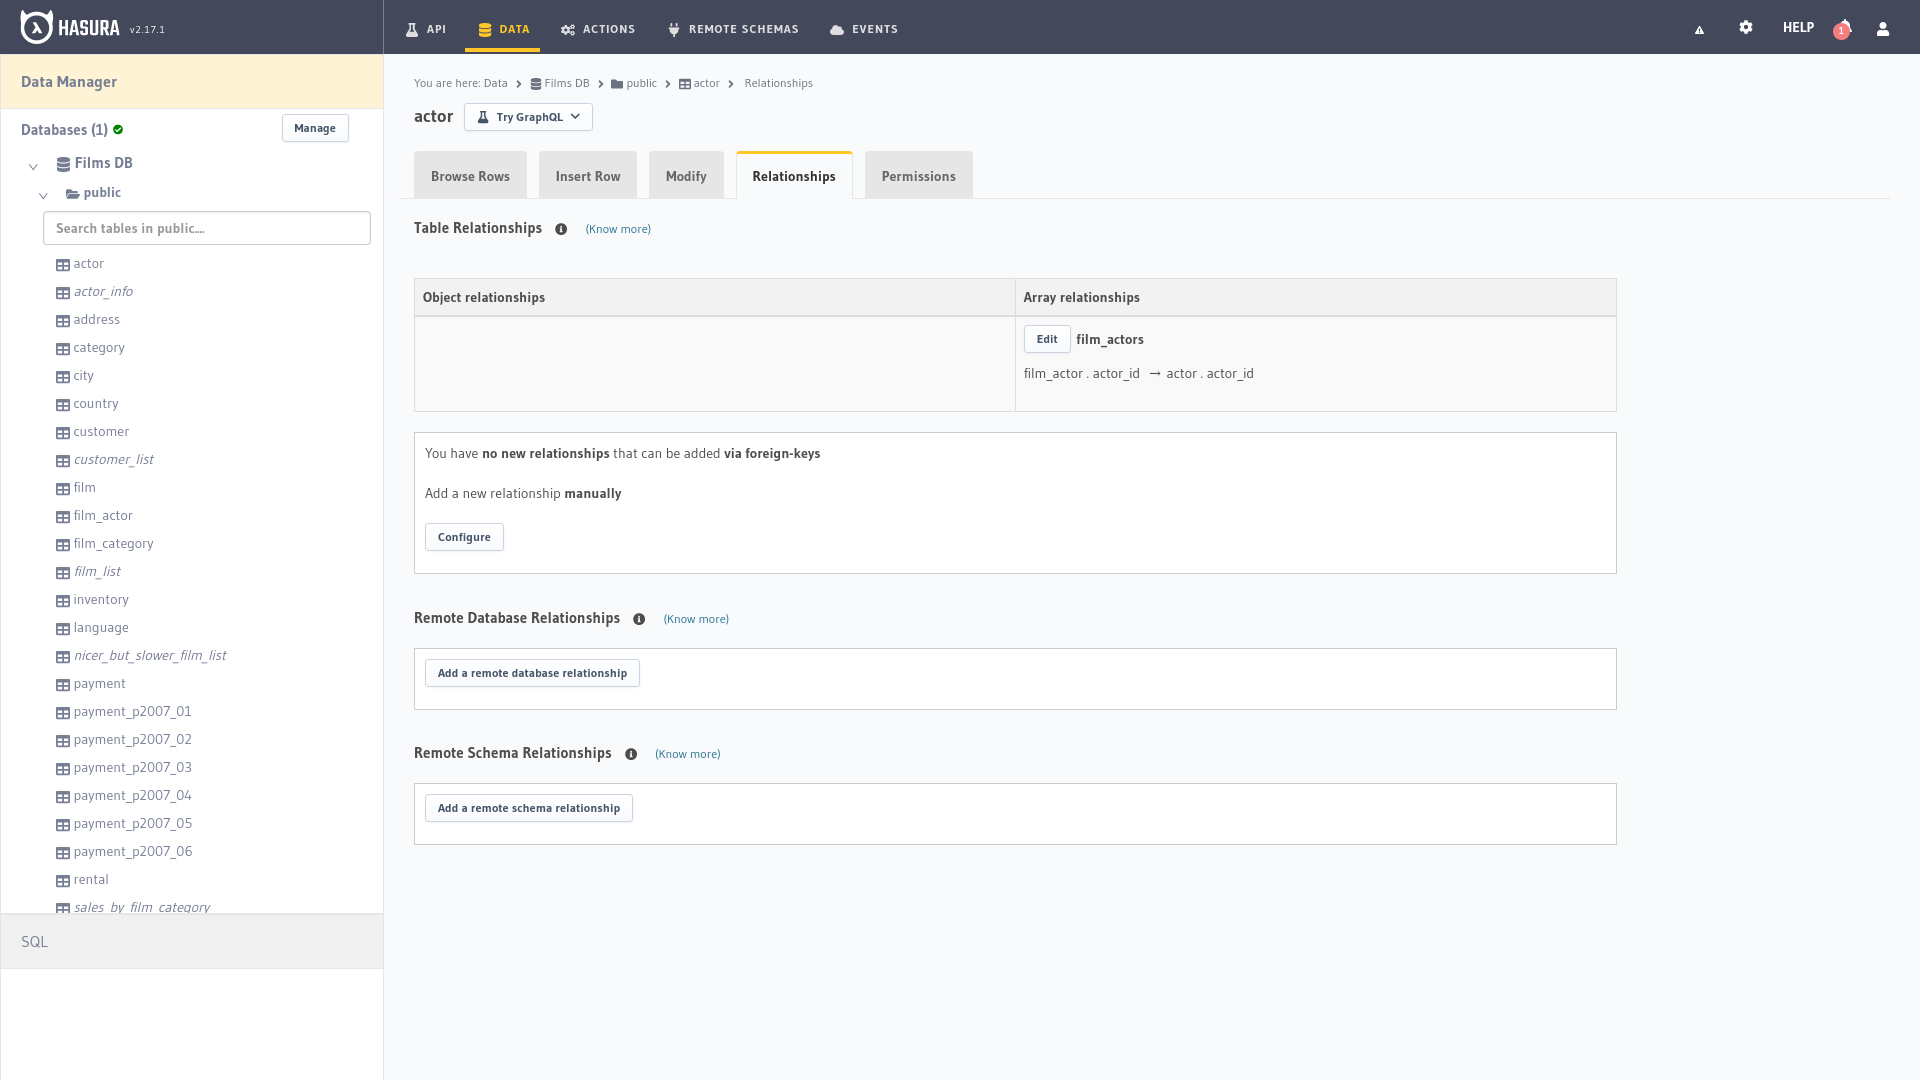
It allows us to manage the relationships between the different entities of our database independently.
The roles and permissions section is used to set the data access controls through API queries, who can insert, access, modify or delete what data and how, the variables they can query, etc. This using a system of roles and permissions flexible enough to cover most of the basic use cases.
We can design a simple user role with limited query and modification access, a moderator role that can modify some tables that the user cannot, or a user role for staff who are allowed access to certain tables that the basic user and the moderator ones aren’t, etc.
If we select the city table on the left we will be able to create the user roles, in the text field that says Enter new role,
type user and click on the red cross in the Select column to open the permissions form:
Row select permissions: It allows us to establish some filter using the variables of the header in the request or other
fields in the database, we leave it without restrictions by activating Without any checks.Column select permissions: Indicates which parameters of the entity will be influenced by this rule. We press the Toggle all
button to enable all the fields making them accessible for this role.Aggregation query permissions: Allows us to indicate if this user role has permissions to make aggregation queries,
such as totals or averages, maximums or minimums. We can leave it by default.Root field permissions: To manage the permissions of the root element, if it is deactivated all are allowed by default.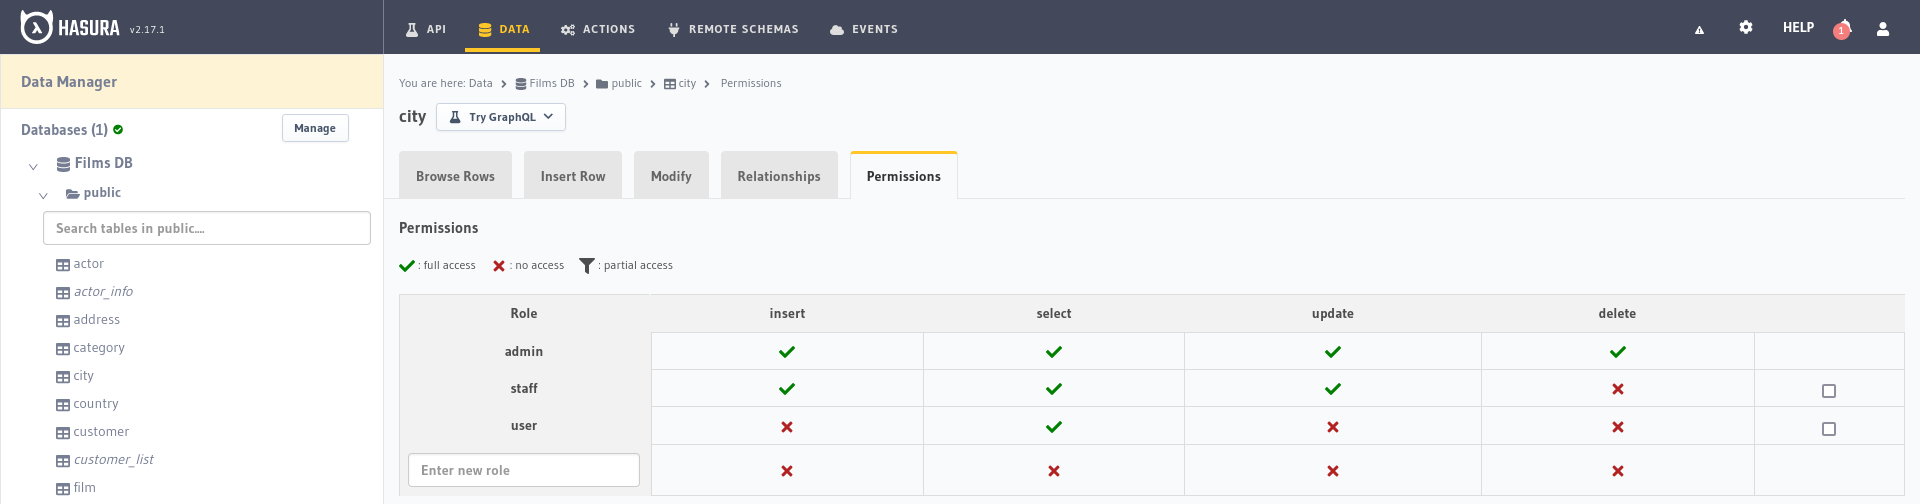
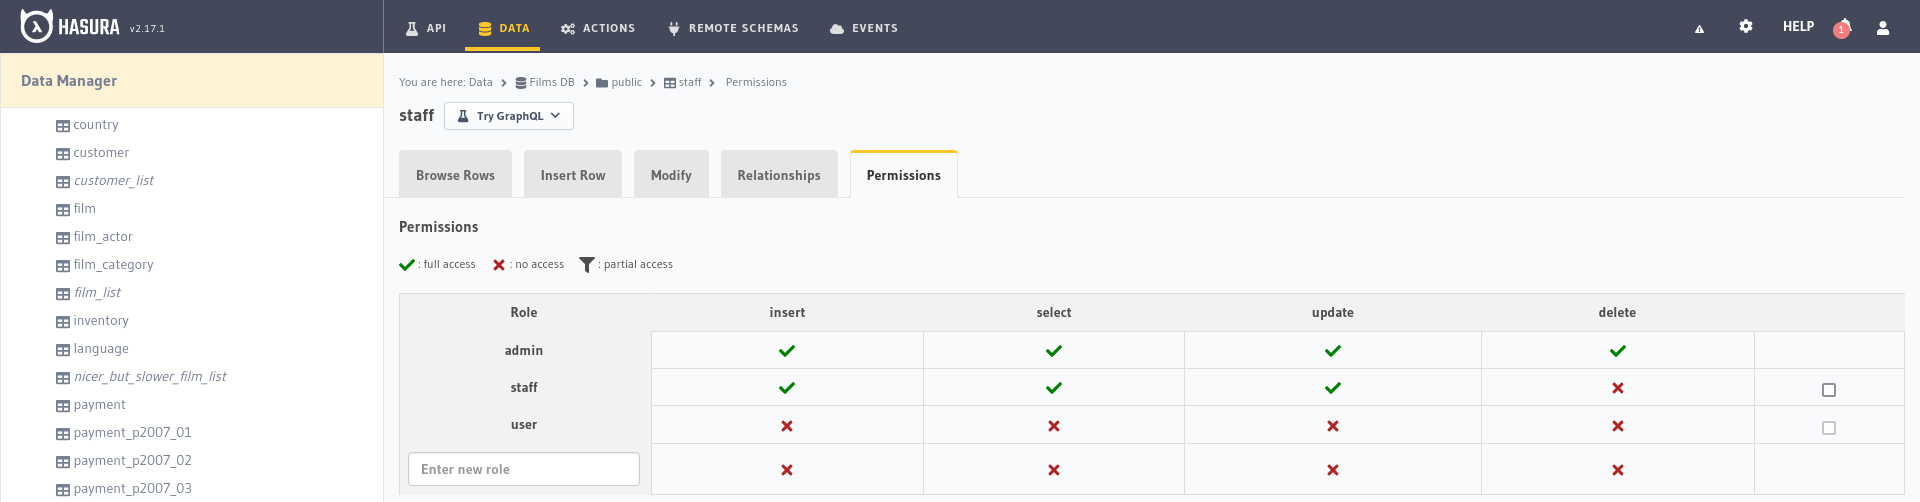
We created the new user role user with selection permissions in the city table without any type of restriction in the
parameters to select, now we can repeat the process to create the role staff and give it the permissions to insert,
select and modify permissions.
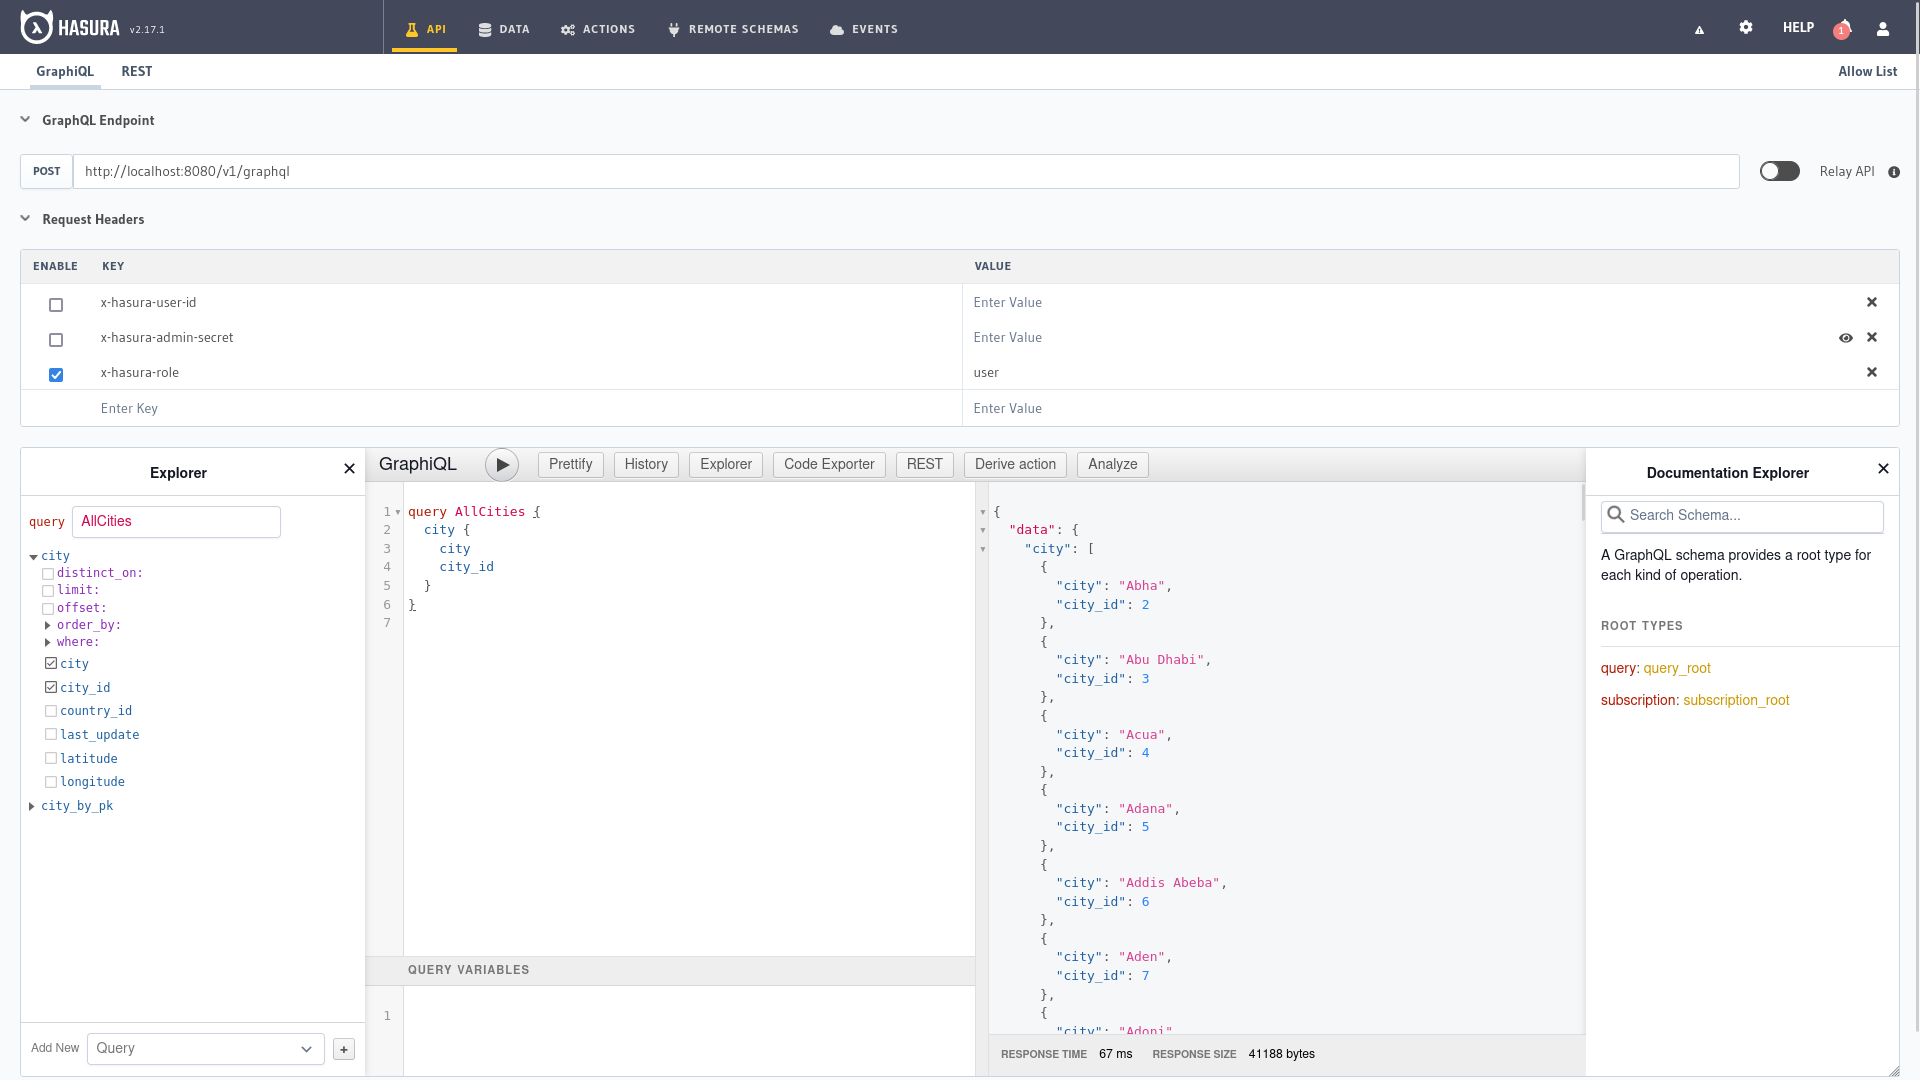
To verify the permissions are being checked correctly we go to the API tab and add to the header of the request the key
x-hasura-role with the value user, we will see that we can only collect the data of city, while if we change it
to staff we can access the staff role data too.
An action is an event that is executed on the server after a call to the API, it allows us to execute certain actions that would not correspond to the usual ones, outside the business logic.
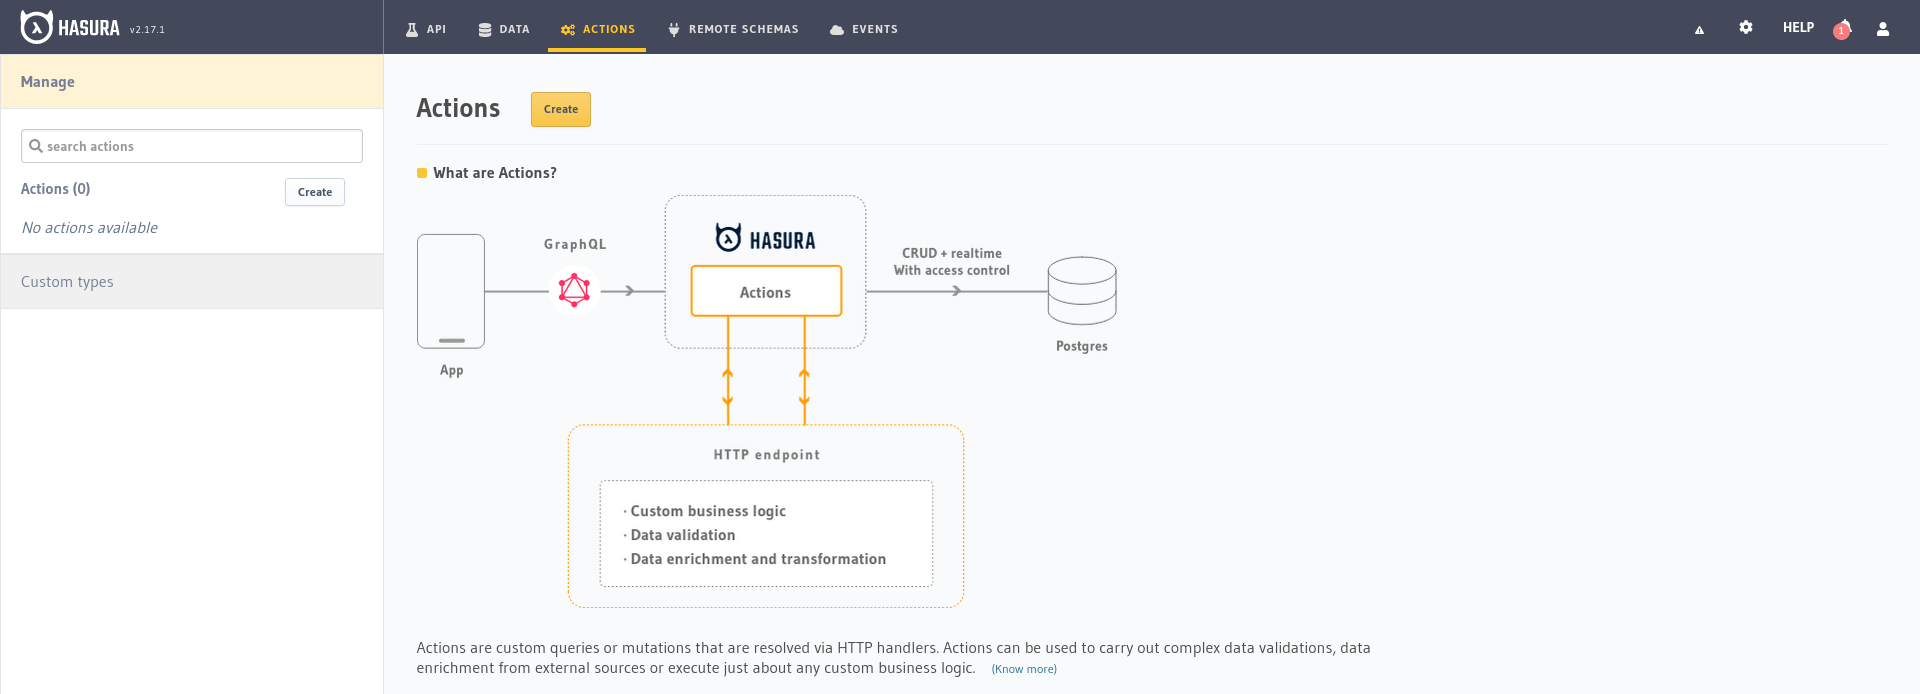
Let’s imagine that in one of our applications we want to display the current weather in a specific city, we could directly call
to Free Weather API of OpenMeteo from the client or we could create an action in our Hasura
that would act as an intermediary and in charge of requesting to OpenMeteo the temperature when we call it from the client.
This type of functionality is designed to manage our data that may require some type of special operation, as we are doing it now has the disadvantage that we make two requests instead of the only one that we would need if we were to make the request directly. Although it also has the advantage of that if an error occurs or a change in the request is required, it would not be necessary to update the client applications.
It is the responsibility of the development team to estimate advantages and disadvantages to determine which method is best for the use case of the project, this is only an example.
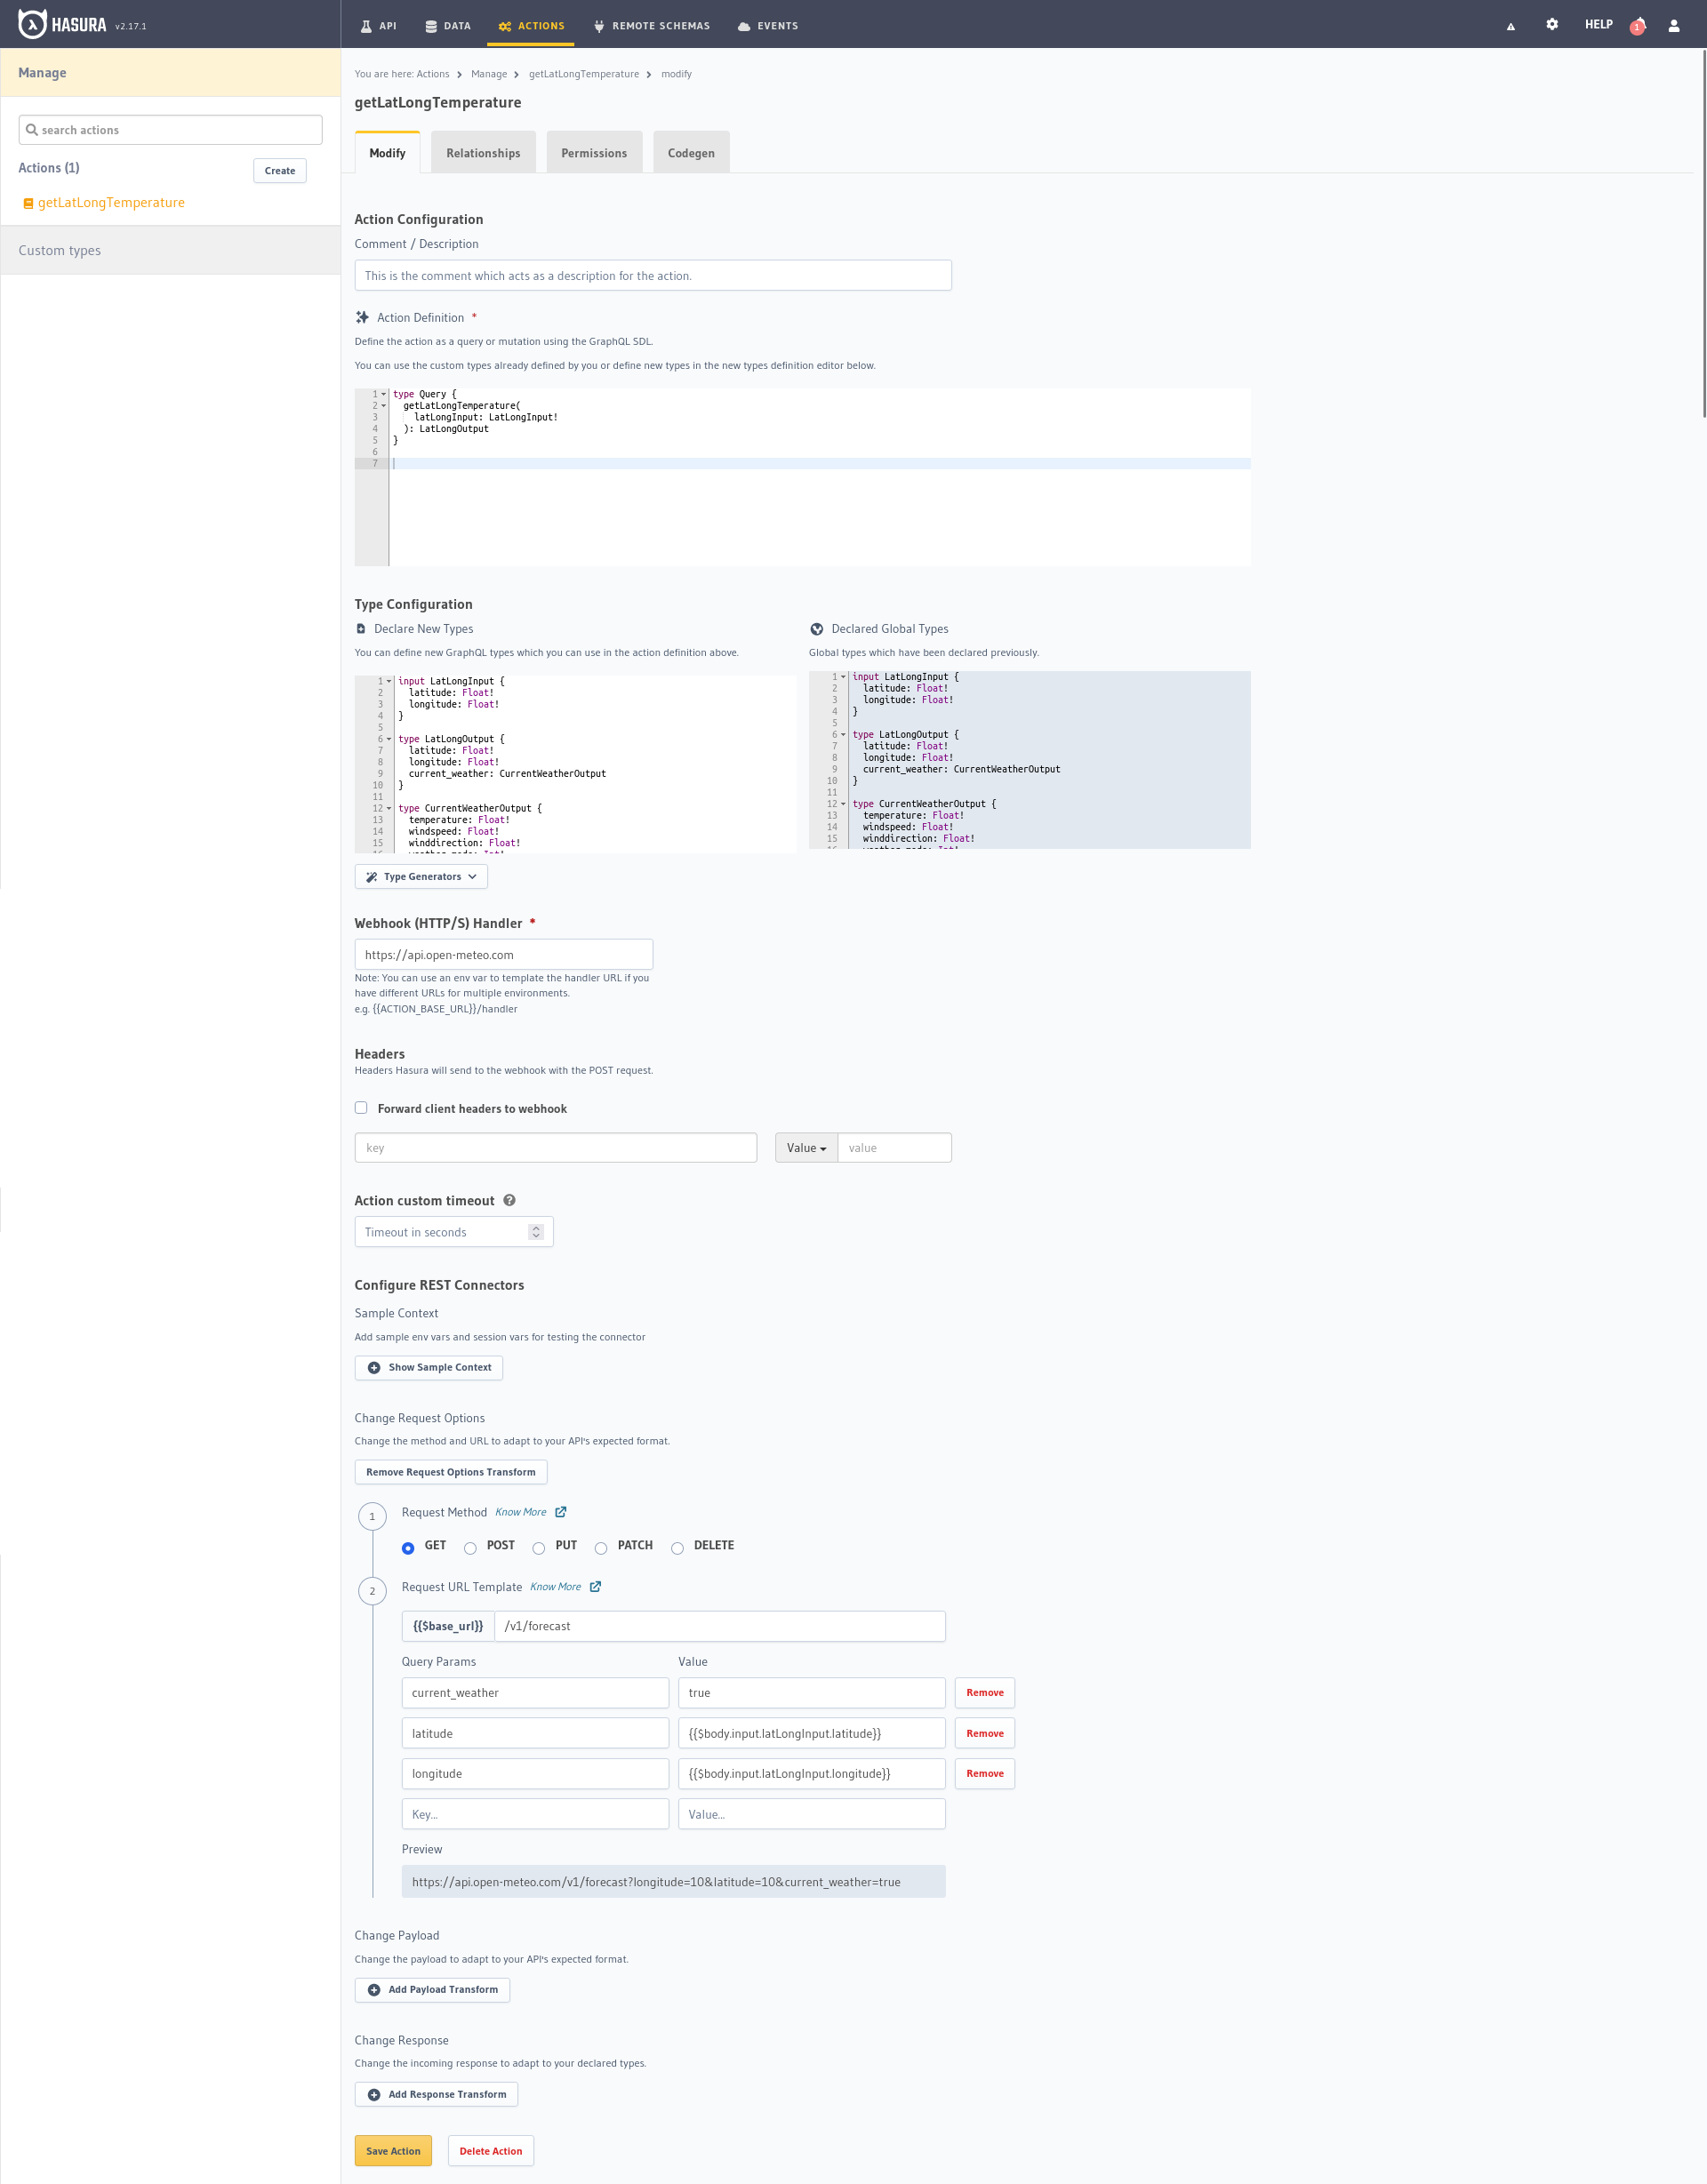
To begin with, we will define the format of the action, the request to be made, in the Action Definiton box.
type Query {
  getLatLongTemperature(
    latLongInput: LatLongInput!
  ): LatLongOutput
}
In the next box Type Configuration we create the data types, we could associate them with the Class concept of object
oriented programming, they define the structure of the data that will be received (Input) and will be responded to (Output)
during the execution of the action.
input LatLongInput {
  latitude: Float!
  longitude: Float!
}

type LatLongOutput {
  latitude: Float!
  longitude: Float!
  current_weather: CurrentWeatherOutput
}

type CurrentWeatherOutput {
  temperature: Float!
  windspeed: Float!
  winddirection: Float!
  weather_mode: Int!
  time: String
}
Both LatLongOutput and CurrentWeatherOutput (which is a subset of the former) correspond to the response we will receive
from the OpenMeteo API, which is similar to the one shown below:
{
  "latitude": 51.5,
  "longitude": -0.120000124,
  "generationtime_ms": 0.2110004425048828,
  "utc_offset_seconds": 0,
  "timezone": "GMT",
  "timezone_abbreviation": "GMT",
  "elevation": 27.0,
  "current_weather": {
    "temperature": 5.0,
    "windspeed": 5.9,
    "winddirection": 259.0,
    "weathercode": 0,
    "time": "2023-01-30T20:00"
  }
}
Here we collect the variables that we may use at some point in any of our clients, then in each request we can specify exactly which data we want in each case.
In the Webhook Handler we have to add the URL of the endpoint to which the request will be sent, the OpenMeteo one: https://api.open-meteo.com
We are going to open the Add request options transform option to add the parameters that we want to send to the OpenMeteo
API, the current_weather flag, latitude and longitude basically.
Método de petición: GET{{$base_url}}: /v1/forecastcurrent_weather: truelatitude: {{$body.input.latLongInput.latitude}}longitude: {{$body.input.latLongInput.longitude}}Using {{$body.input.latLongInput.latitude}} we access the latitude value in the body of the input request, once we are
done it should show us a temporary address in the Preview below: {{$body.input.latLongInput.latitude}}.
https://api.open-meteo.com/v1/forecast?longitude=10&latitude=10¤t_weather=true
Link that we can consult directly in the browser to check that it works and returns the data we expect.
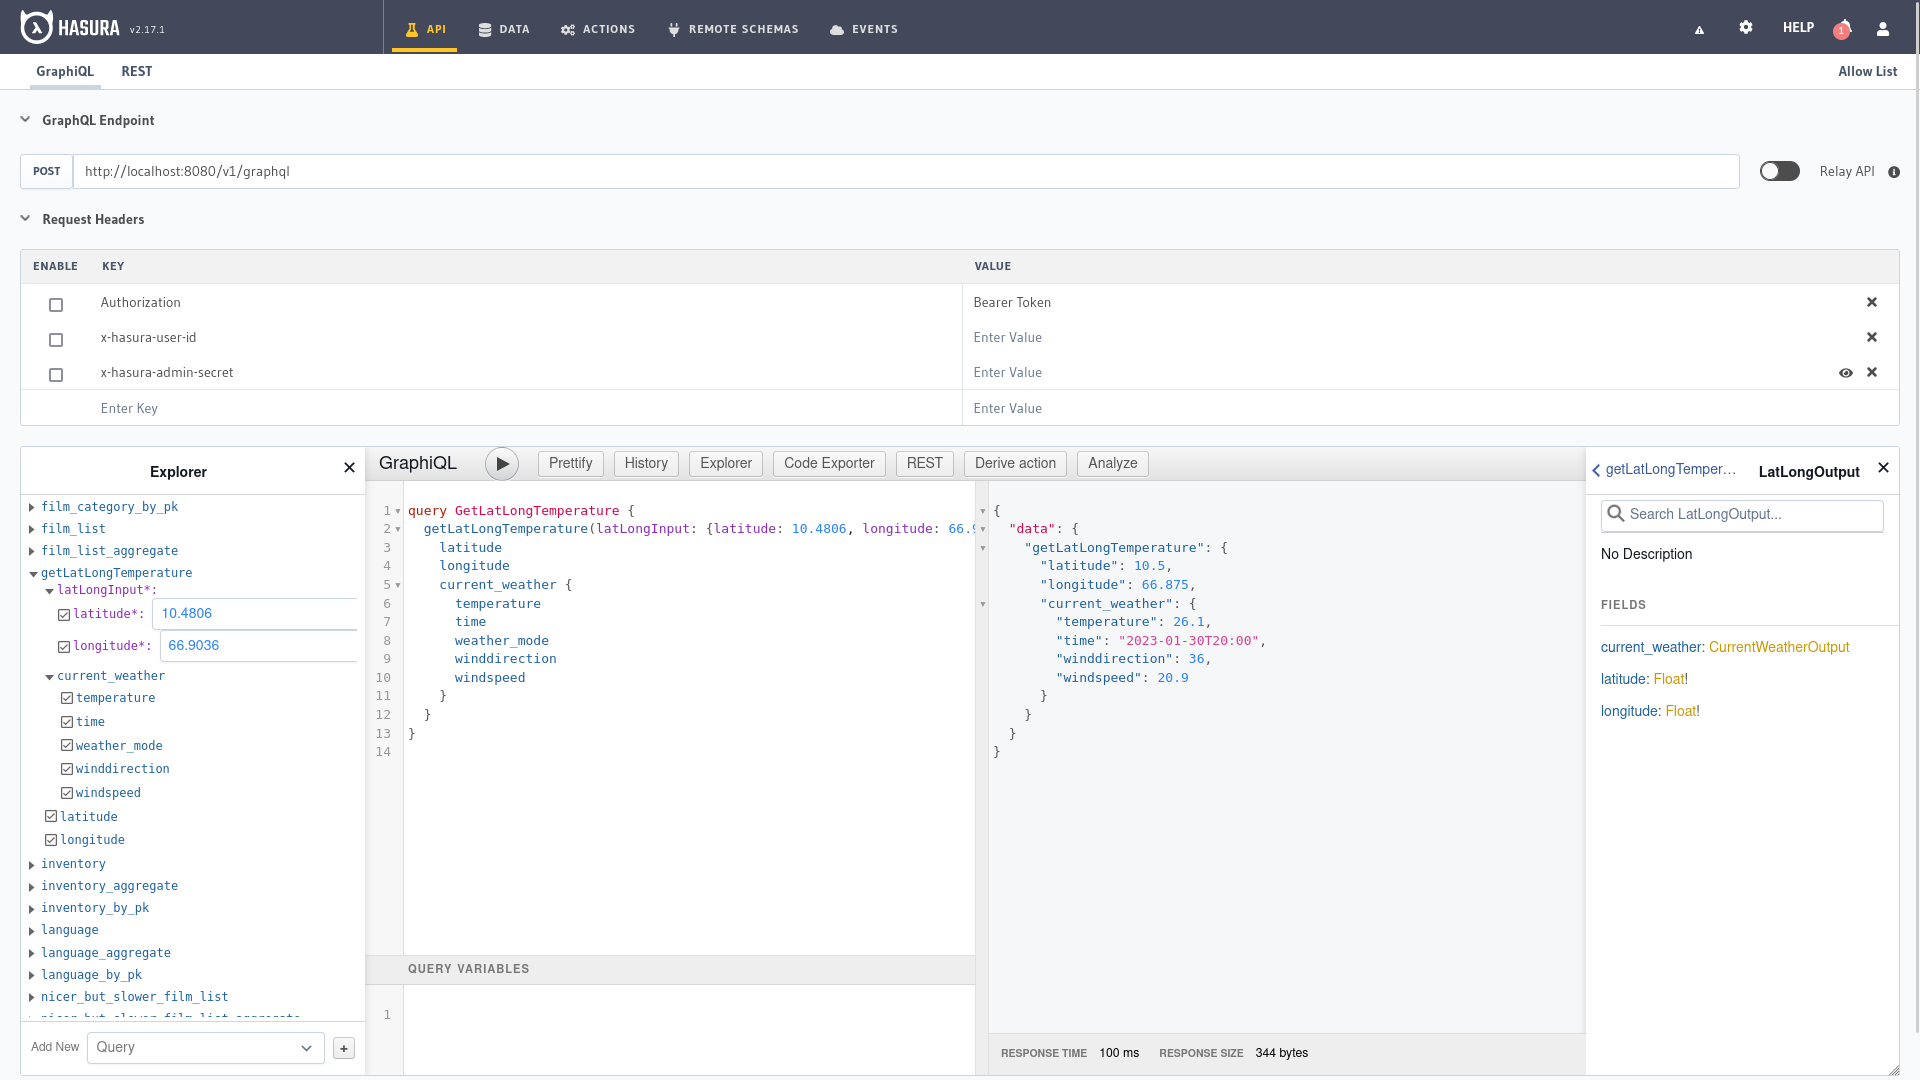
Now we can test the action from the Hasura administration panel, in the API tab we enter the following query:
query GetLatLongTemperature {
  getLatLongTemperature(latLongInput: {latitude: 10.4806, longitude: 66.9036}) {
    latitude
    longitude
    current_weather {
      temperature
      time
      weather_mode
      winddirection
      windspeed
    }
  }
}
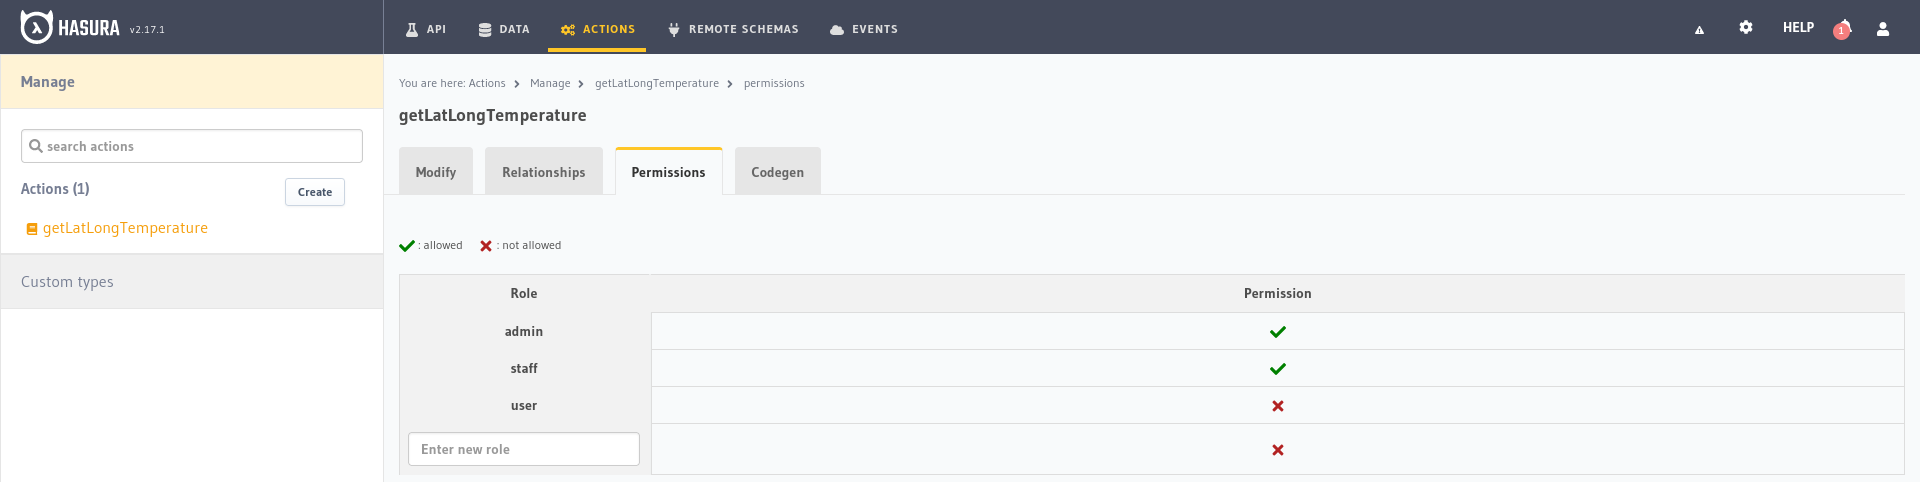
We could also limit access to this function using permissions just as we do with database tables. Assuming that the temperature
was a functionality only available to staff users we would restrict it so that only their role can access it from the Permissions
tab within the action options.
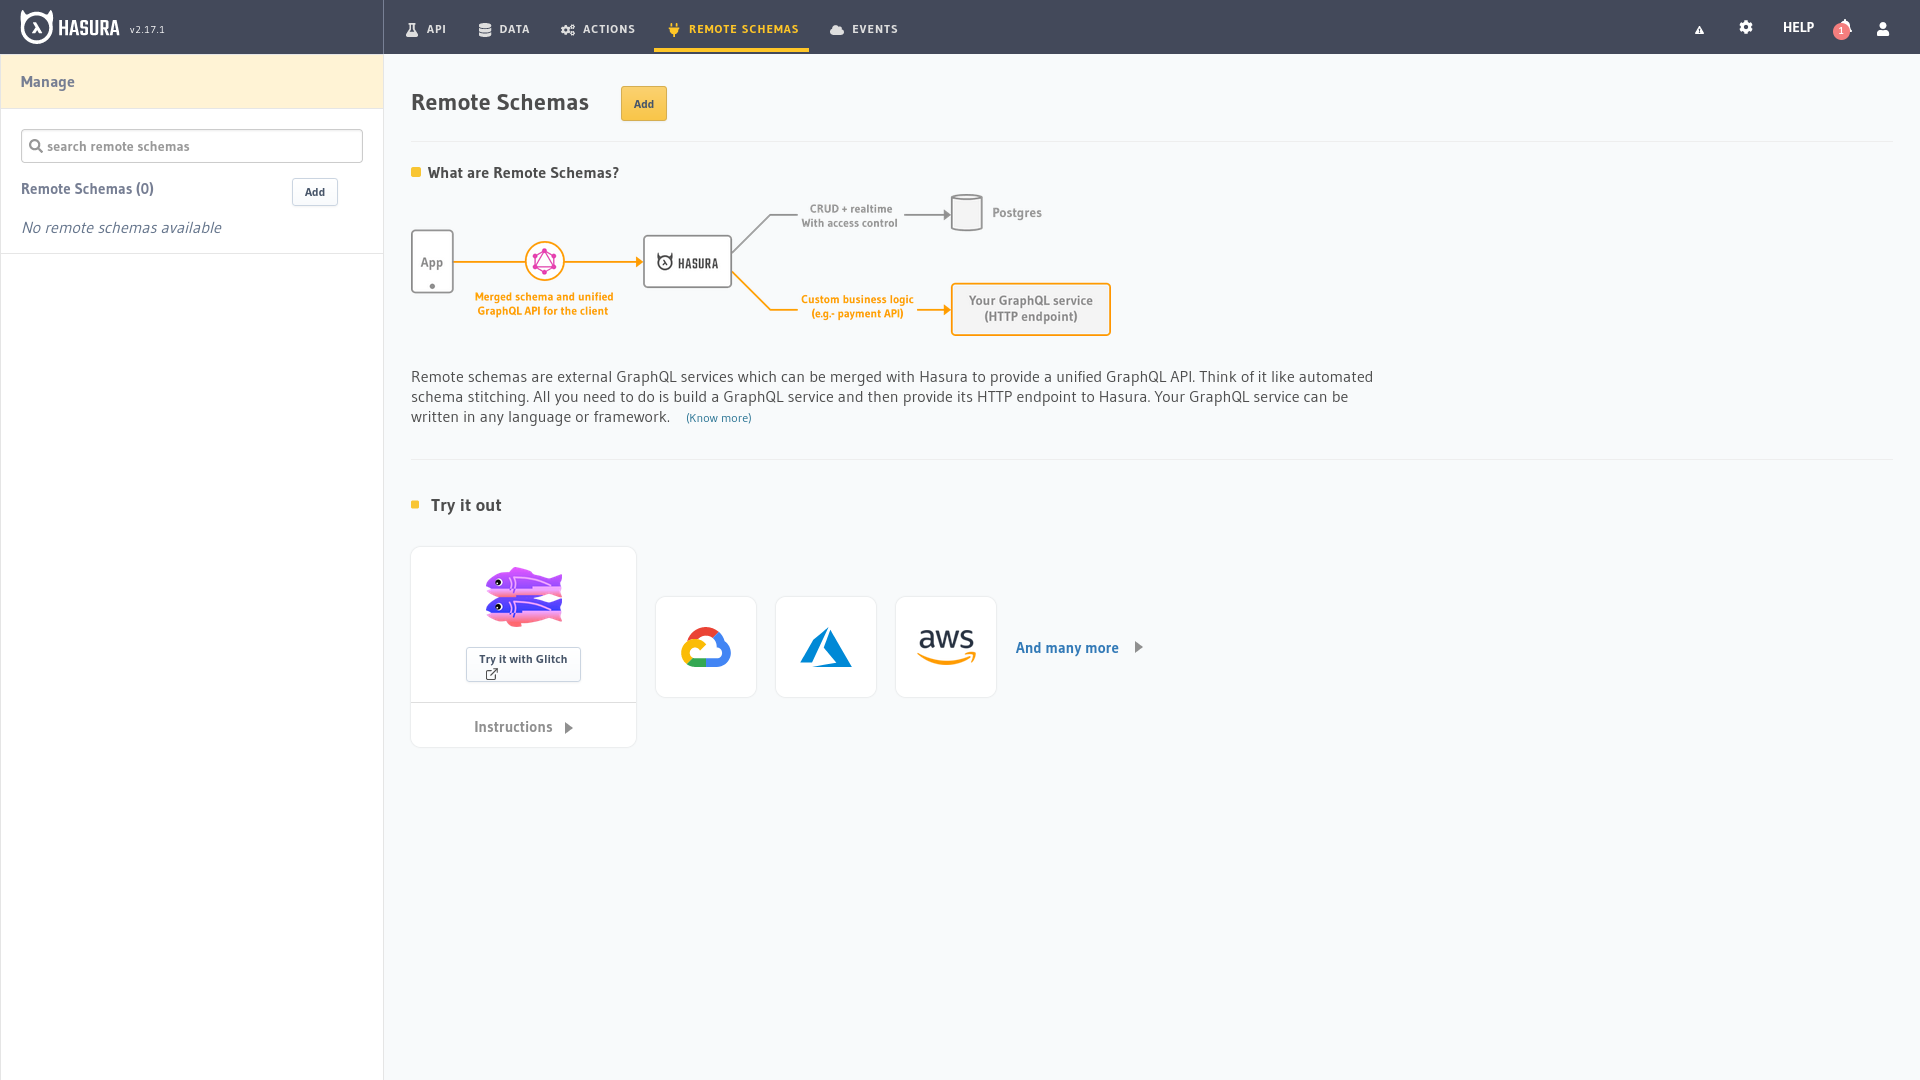
With the remote schemas we can connect GraphQL schemas from other sources in case we have any additional GraphQL APIs and would like to unify them.
Events unlike actions are executed automatically when an operation is performed on the database either from the API or from
any other source, the equivalent of triggers in PostgreSQL.

They are mainly used to call serverless or webhooks functions that will be executed when an event occurs. In order to
test it we are going to enter in Webhook.site and to copy the URL that it provides us to add it
in the configuration of our event as Webhook URL.
We fill in the form as follows:
Event Name: I have given it “cityInsertEvent” but you can give it any name you want.Database: “Films DB”, the name we gave it when we created it.
Schema: “public”.Table: “city” or the table in which we want the event to be executed.Trigger Operation: Select Insert to notify us every time a new city is inserted.Webhook URL: The URL provided by Webhook.site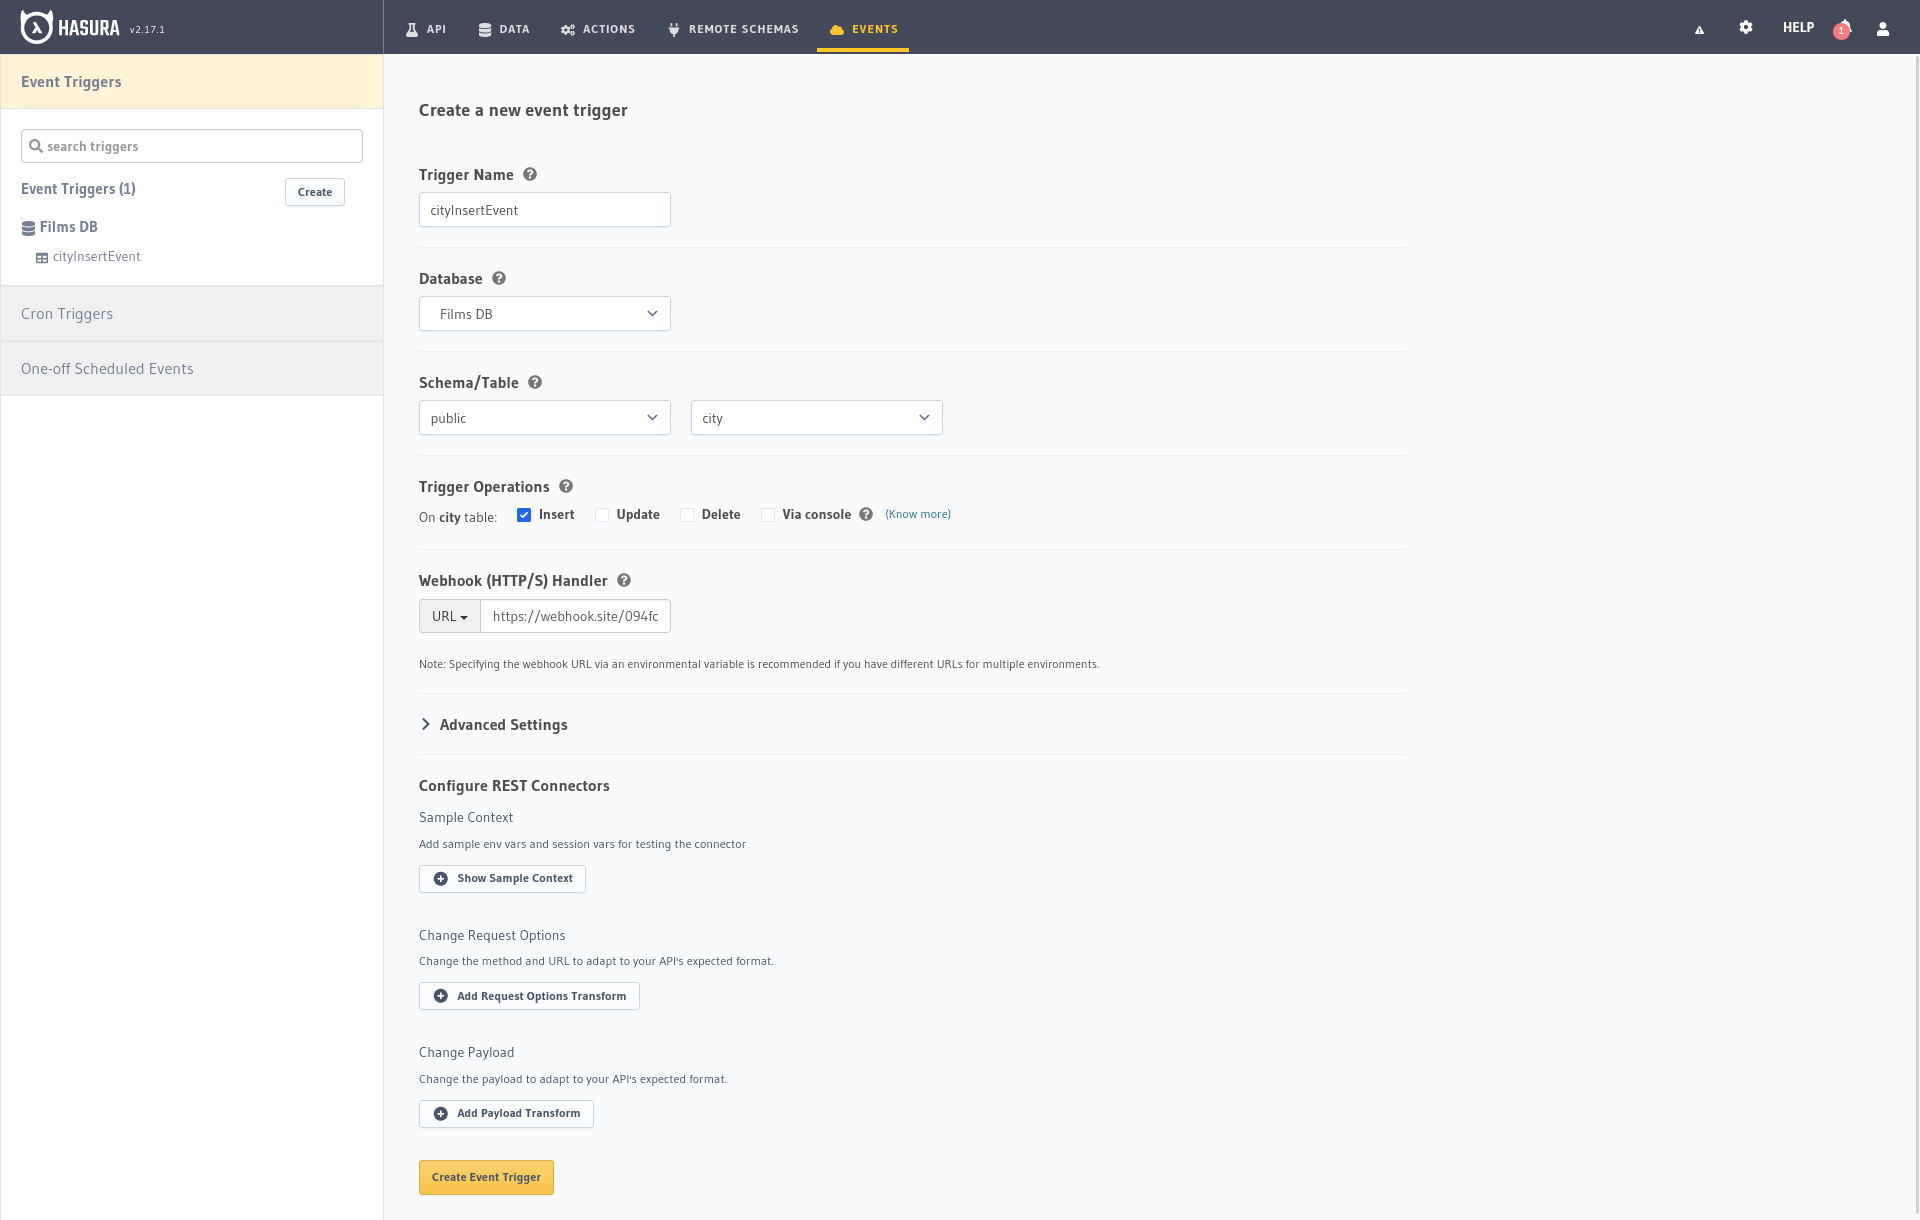
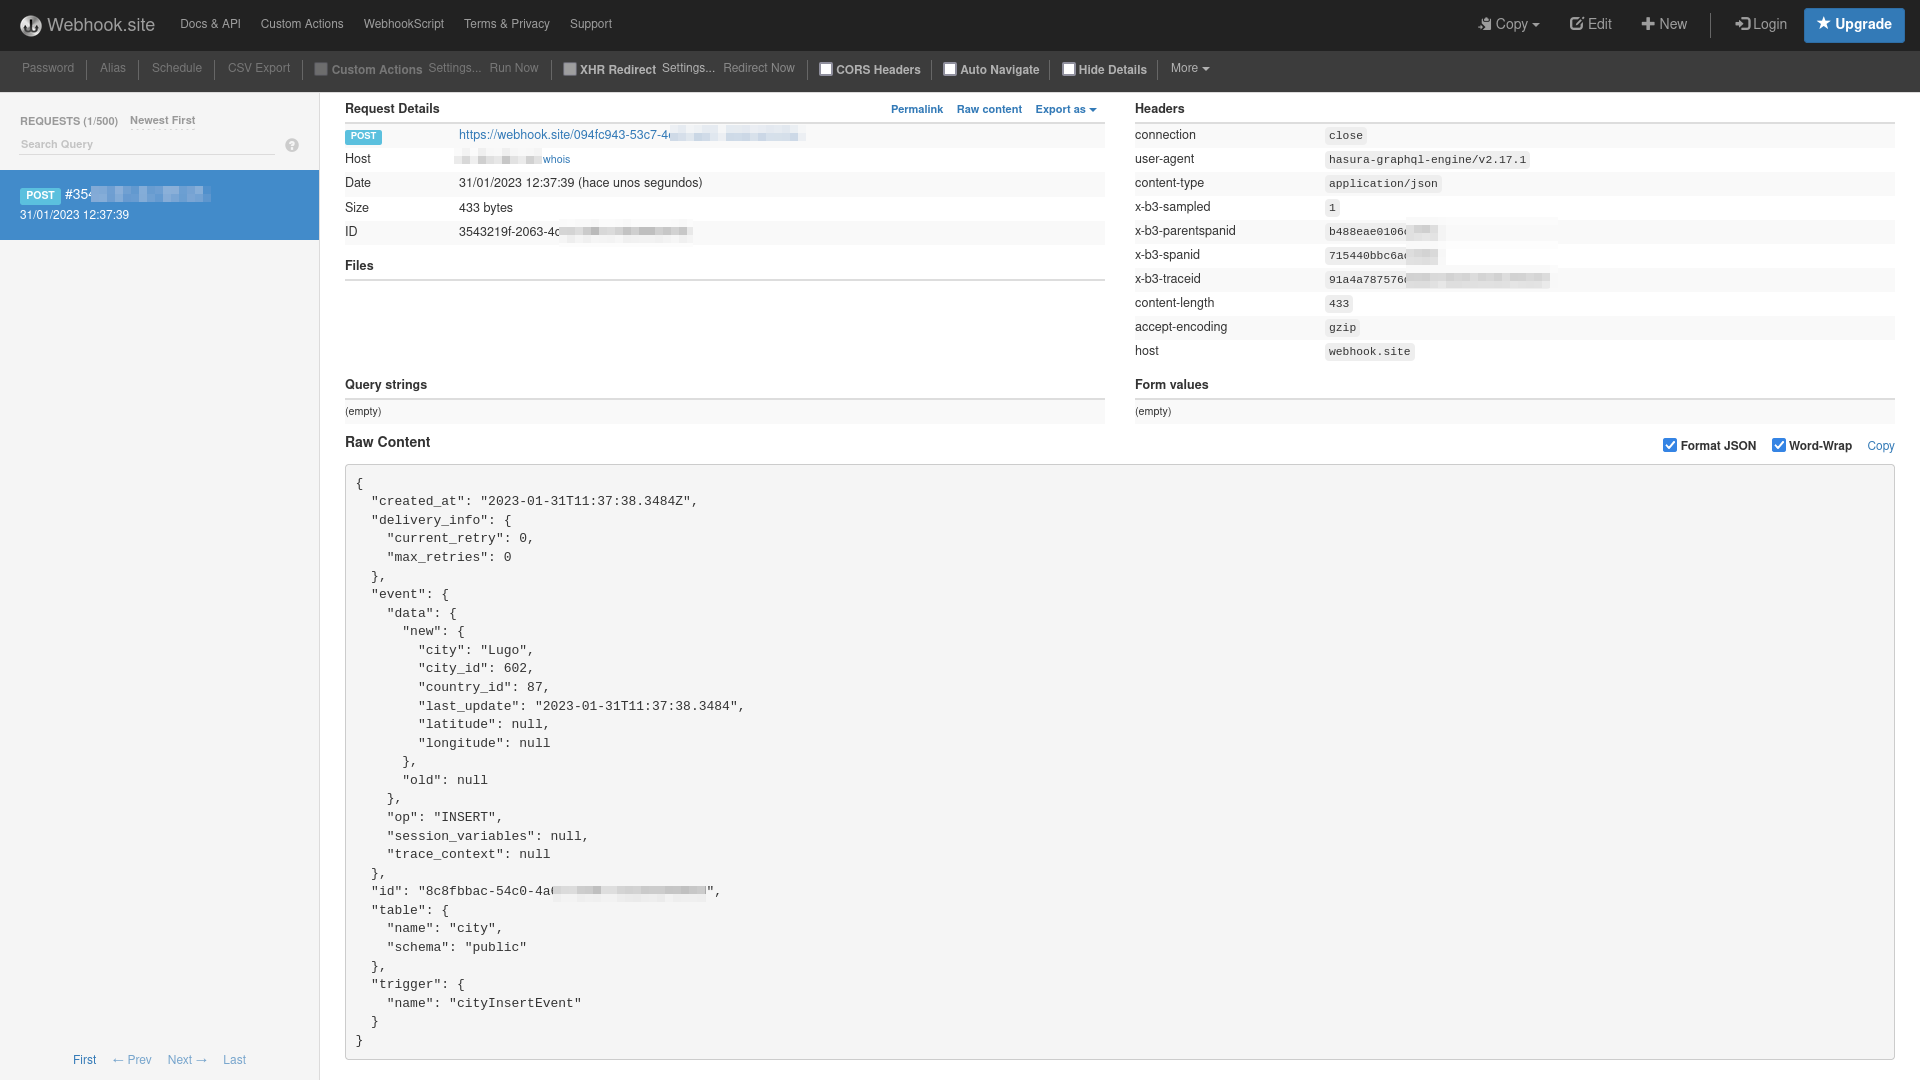
Now we can insert from any source (the Hasura panel itself) a new city to check our event is executed and notifies
us automatically in the server that we have indicated with the URL. In the panel of Webhook.site we
will see all the information of the request received with the data of the received request with the data that were inserted
if everything has gone well.
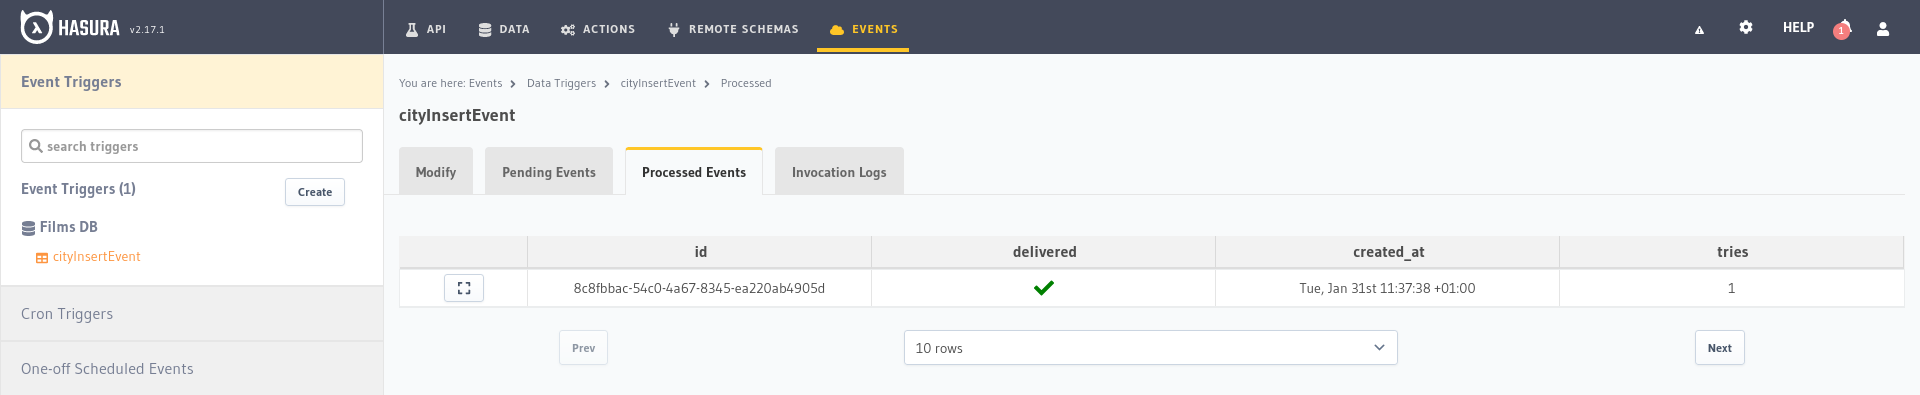
By selecting the event we have just created in the Hasura administration panel we can see the processed requests, pending and the logs that keep a record of the function calls.
The Cron triggers allow us to execute events periodically, for example to perform a database cleanup and the One-off scheduled events
allow us to execute scheduled events at a specific time.
We have reviewed almost all the features available in Hasura and we have played with its actions, events and roles. They are not as fundamental as the default data management but they provide an added value that can be very useful in many cases.
From queries right in the API explorer to role and permissions management, a powerful tool that would take many hours of work to be developed independently.
Actions allow us to execute a predefined function, usually outside the business logic of the application very similar to what the events do, send calls to serverless functions or other external endpoints but automatically after the occurrence of an event in the database.
That may interest you
In the previous chapter we saw how to create a project with Hasura and Docker in a matter of minutes …
read moreGraphQL is an open source query and data manipulation language for new or existing data. It was …
read moreAt the beginning, when we have a developed application and want to publish it, many questions arise. …
read moreConcept to value